A high P/E ratio can signal investor optimism about future earnings growth but may also suggest that the market is overvalued. Conversely, a low P/E ratio might indicate that the market is undervalued, but it could also reflect poor growth prospects.
By comparing the current P/E ratio to historical values, investors can make more informed decisions and better identify potential risks and opportunities in the market.
What is the Price to Earning for a Market?
The P/E ratio is calculated by dividing a stock’s price by its earnings per share (EPS). It measures how much investors are willing to pay for each dollar of earnings. For instance, if a stock is priced at INR 100 and the company earns INR 4 per share, the P/E ratio is 25, meaning it would take 25 years to recoup the investment based on current earnings. This ratio is also used for stock indexes like the NIFTY 50, reflecting changing stock prices and quarterly earnings reports.
The Price-Earnings (P/E) ratio is a key metric for evaluating a company’s valuation by comparing its current stock price to its earnings per share. Various variants of PE can be explored in greater detail by investors.
Advantages:
- Easy to understand
- Helps assess stock valuation
- Facilitates comparison with industry peers
- Indicates potential growth and profitability
- Provides a risk assessment snapshot
Disadvantages:
- Ignores company debt
- Not suitable for start-ups or cyclical industries
- May not reflect true company value due to market conditions.
Historical Market Valuation and Future Returns
Though it is not a rule that something expensive can keep on becoming more expensive and vice versa it is generally seen historically that allocation based on various levels can be used as one of the factors while investing.
Historical data shows that stock market performance tends to vary significantly based on the prevailing P/E (price-to-earnings) ratios. Here are some insights on how markets have performed following periods of low and high P/E ratios:
- Low P/E Ratios: Historically, when markets have low P/E ratios, they tend to deliver higher returns in the following years. This pattern is primarily because low P/E ratios often indicate undervaluation, meaning the market prices are low relative to earnings. For instance, a study on the S&P 500 shows that when the P/E ratio is below its long-term average, subsequent 5-year returns tend to be higher. Low P/E ratios suggest pessimism among investors, which can lead to significant upside if earnings improve or market sentiment shifts.
- High P/E Ratios: Conversely, high P/E ratios often signal overvaluation, where market prices are high relative to earnings. Historically, periods following high P/E ratios tend to see lower returns as the market may need to correct itself. For example, when the S&P 500’s P/E ratio is significantly above its historical average, the market has often experienced lower returns or even declines in the subsequent years.
Indian Stock Market Historical PE and Performance
The below table shows Nifty 50’s average performance based on its Price-to-Earnings (P/E) ratio, focusing on how different P/E levels impact future returns.
The data shows that lower P/E ratios correlate with higher future returns, while higher P/E ratios correlate with lower future returns. This historical analysis helps investors understand the potential risks and rewards associated with different valuation levels of the market.
- Low P/E Ratios and High Future Returns:
- When the Nifty P/E ratio is low (below 12), the subsequent 1-year, 3-year, and 5-year returns tend to be very high. Historically, investing at these low P/E levels has yielded excellent returns.
- This indicates market undervaluation, presenting significant buying opportunities.
- High P/E Ratios and Low Future Returns:
- Conversely, when the Nifty P/E ratio is high (above 24), future returns are generally lower. This suggests that the market is overvalued and may not offer good entry points for new investments.
- High P/E levels are often followed by periods of lower returns or corrections.
- Intermediate P/E Ratios and Moderate Returns:
- For P/E ratios between 12 and 24, the returns are more moderate. These levels are less clear market direction indicators, representing fair valuation zones.
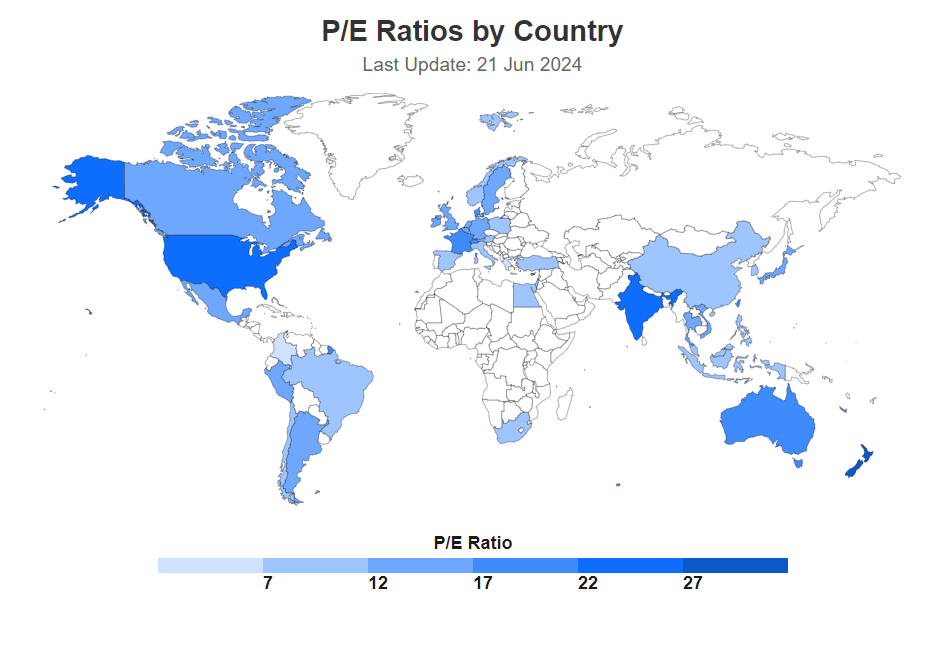
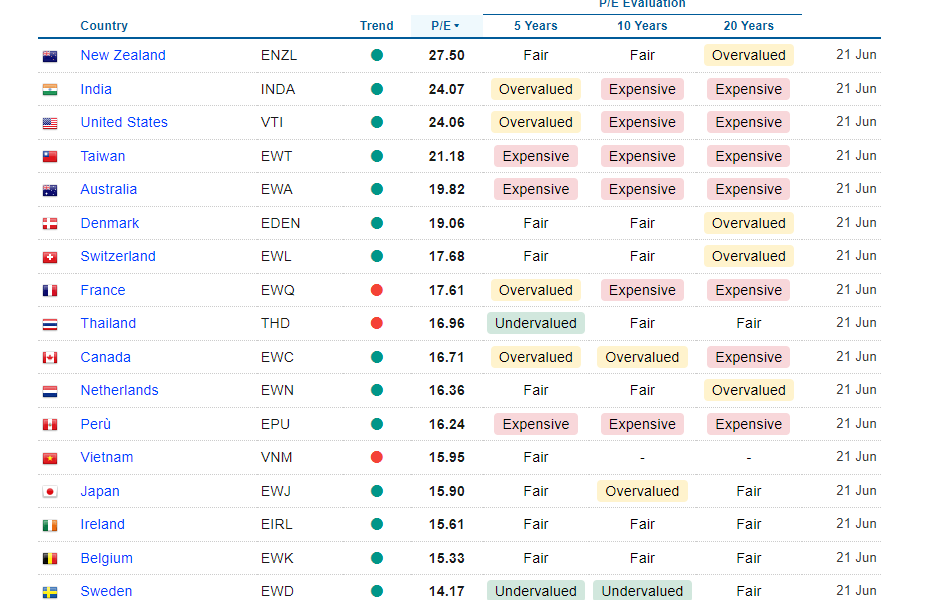
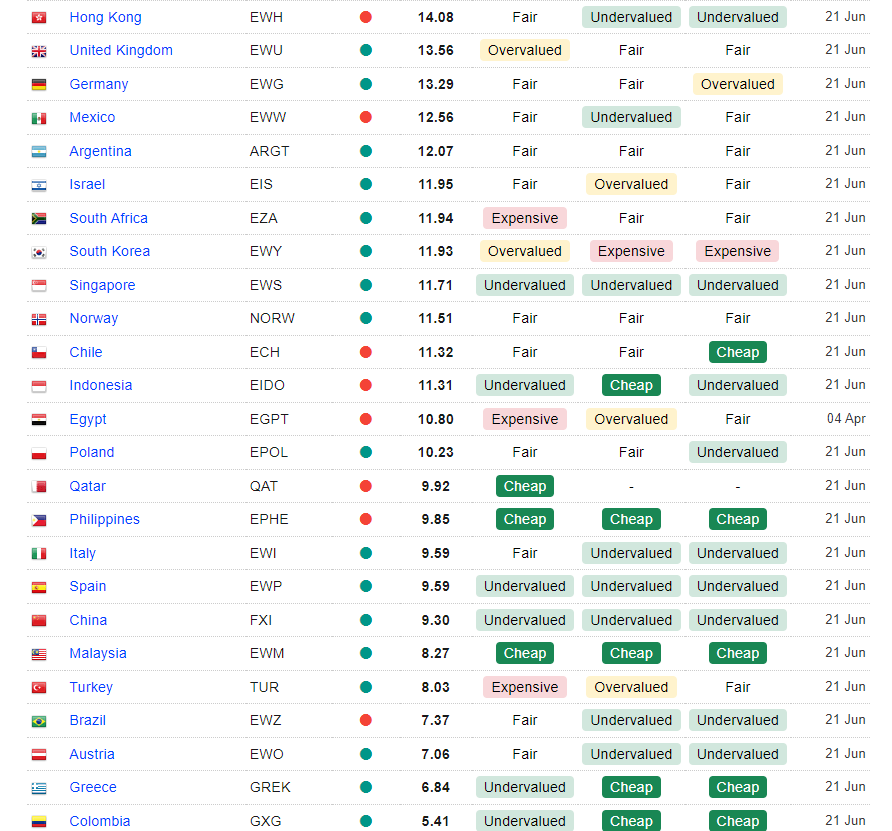
Most Expensive and Cheapest Countries Currently

As of 2024, the most expensive stock markets include India, the United States, and New Zealand. These markets have high CAPE (Cyclically Adjusted Price-to-Earnings) ratios, reflecting elevated valuations relative to historical averages. For instance, the Indian stock market’s high CAPE ratio indicates persistent high multiples due to continuous market gains.
Of course, some markets like Russia are cheap because of war and uninvestable at the moment. Below are some of the other cheap markets.

Brazil
The Brazilian stock market, represented by the Bovespa Index, has a price-to-earnings (P/E) ratio of around 8.72 as of January 2024. This is significantly lower than its historical average, indicating potential undervaluation. The low P/E ratio can be attributed to several factors:
- Economic and Political Volatility: Brazil has experienced political instability and economic challenges, including high inflation and fluctuating commodity prices, which have deterred investors.
- Commodity Dependence: Brazil’s economy is heavily reliant on commodities. Fluctuations in commodity prices, particularly oil and agricultural products, can significantly impact market performance.
- Currency Depreciation: The Brazilian real has seen substantial depreciation against the dollar, affecting foreign investors’ returns and lowering market attractiveness
Indonesia
The Indonesian stock market, with a P/E ratio of around 15.7x, is also considered undervalued. Contributing factors include:
- Economic Growth and Market Cap: Indonesia’s market cap relative to its GDP is about 37.48%, which is modestly undervalued according to the Buffett Indicator. The economy’s solid GDP growth has not been fully reflected in the stock market valuations.
- Political Stability and Governance: While relatively stable, concerns about corruption and regulatory transparency continue to weigh on investor confidence.
- Liquidity Issues: Limited market liquidity and the dominance of a few large conglomerates can lead to underperformance in the broader market.
Philippines
The Philippines stock market shares similar issues that contribute to its low valuation:
- Economic Vulnerabilities: The economy is susceptible to natural disasters and global economic shifts, which can disrupt growth and investor confidence.
- Political Environment: Political instability and concerns over governance have historically affected investor sentiment negatively.
- Market Liquidity: Like Indonesia, the Philippines also faces challenges with market liquidity and investor diversification, limiting the market’s growth potential.
China
China’s stock market valuations are low for several reasons:
- Economic Slowdown: China’s economy has been underperforming post-COVID, with sluggish growth disappointing both domestic and international investors. The real estate sector, a significant part of the economy, has been particularly troubled. Major developers like Evergrande and Country Garden are struggling with defaults, leading to excess housing supply and falling prices.
- Youth Unemployment: High youth unemployment, which has been rising steadily, is another critical issue. This has dampened consumer sentiment and spending, further slowing economic growth.
- Government Crackdowns: Regulatory crackdowns on leading companies, especially in the technology and education sectors, have increased investor uncertainty. These actions have made both foreign and domestic investors wary of the investment climate in China.
- Geopolitical Tensions: Ongoing geopolitical issues, particularly with the United States, have also played a role. The US’s attempts to curb China’s technological advancements have led to an increased focus on domestic innovation, but this shift takes time and adds to investor concerns about the stability and future profitability of Chinese firms.
- Policy Responses: While the Chinese government has taken steps to support the economy, such as cutting interest rates and increasing fiscal spending, these measures have not yet fully restored investor confidence. The property sector’s restructuring and overall economic reforms are long-term processes that contribute to the current low valuations
How to Invest in all countries’ stock markets from India?
While there are some strong rationales for investing in countries with attractive valuations there is an element of risk that investors should understand and based on that can consider investing in these countries.
Brazil
HSBC Brazil fund, is a fund of funds that gives exposure to stocks in Brazil. Another way is to buy Brazil ETF On Stockal .
Philippines and Indonesia
While there is no direct mutual fund for each country Edleweiss ASEAN offshore equity mutual fund can provide this opportunity.
Hongkong and China
We covered in detail various ways to invest in China such as
- Nippon Hangsengbees ETF
- Edelweiss Greater China MF
- MSCI China ETF on Stockal
Conclusion
While investing in an undervalued market seems an interesting proposition, investors should weigh the pros and cons and only allocate a part of their portfolio to such opportunities. We have some exposure in the above market and will be covering the quarterly performance of these markets to understand and share more insights. To get more insights on Alternative Investments visit our website below
