Introduction
Investing is a data-intensive pursuit! As of October 2024, there are over 2,379 companies listed on the National Stock Exchange and 5,505 companies on the Bombay Stock Exchange. Each of these companies announces its financial statements, earnings reports, exchange and regulator filings, etc. Besides, every single trade (price, volume, time) generates data. Additionally, macroeconomic indicators like GDP, inflation, interest rates, and employment figures heavily influence markets. This goes on to show how information dominates the markets.
Investing is much about processing all this information in a manner that makes well-informed investment decisions. Evidently, for an individual investor, this requires a herculean effort and can be overwhelming, if not impossible. This is where stock research and analysis tools come in, making the job simpler for the average investor. These tools offer lucid and easily comprehensible insights into the markets, individual stocks and other commodities based on algorithmic processing of historical data. In this article, we will review one such popular stock research and analysis tool- InvestingPro.
What is InvestingPro?
InvestingPro is a premium stock research and analysis tool offered by Investing.com. The platform offers actionable insights into listed companies based on several fundamental and technical parameters that help investors make well-informed investment decisions.
Investing.com is a financial markets platform that provides real-time data, quotes, charts, financial tools, breaking news, and analysis across 250 exchanges around the world in 44 language editions. Founded in 2007, with more than 46 million monthly users today and over 400 million sessions, Investing.com is one of the top global financial websites. In addition to the global Stock Markets, the platform also covers Commodities, Cryptocurrencies, World Indices, World Currencies, Bonds, Funds & Interest Rates, etc.
While Investing.com gives simplified insights based on real-time data and gives investors access to real-time information affecting stock prices and market activities, InvestingPro provides actionable insights and analysis to help investors make investment decisions instead of having to rely on their own research.
Before we look at how one can use InvestingPro in detail, let’s have a look at what they offer in brief.
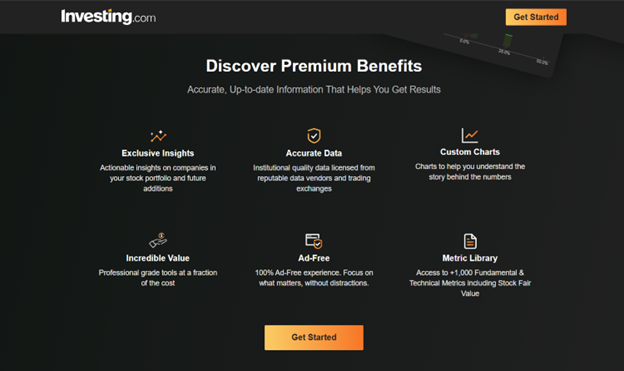
InvestingPro claims to use institutional quality data licensed from reputable data vendors and trading exchanges to give investors access to investment recommendations and actionable insights on their existing portfolios. The platform provides a wide range of stock research and technical analysis tools to help investors navigate the markets in a streamlined manner. These include charts, screeners, financial health indicators, pre-built valuation models, stock and strategy recommendations based on AI-generated insights, etc.
How to Use InvestingPro?
First, let’s go through the interface of InvestingPro, and then we will look at the platform’s different tools.
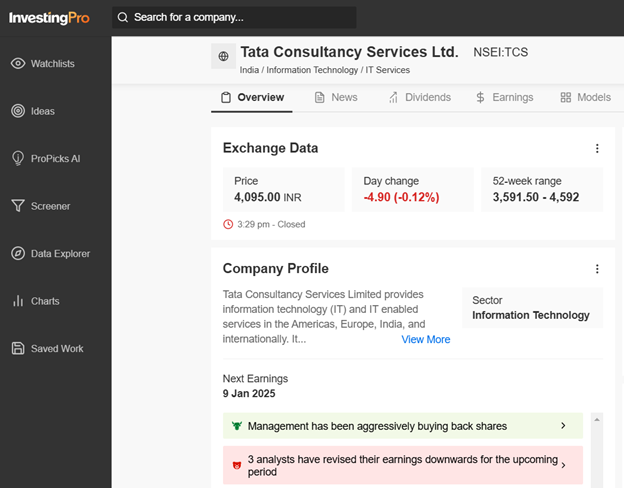
On the extreme right, there’s a navigation bar with a list of different tools. You can search for a company you’re looking to invest in or learn more about. Once you have selected a company, you can access different pages for specific categories of data and insights for that company.
You can go through the Overview page, offering quantitative and qualitative insights into the stock. These include exchange data, stock’s fair value analysis, the company’s profile, including its sector and peers, the financial health of the stock, price history, comparison based on peer benchmarks, the company’s financials and more. The Overview page also lets you choose from multiple pre-built analysis models to help you understand how the stock has performed historically.
The Fair Value indicator gives a potential upside target for the stock based on 15+ pre-built financial models. The fair value average and the upside figure give you an idea of how the stock price could move and whether you should invest or not. The Fair Value feature also helps you look at how different analysts have predicted the stock’s price and gives you an average price based on analyst targets. The stock’s fair value is arrived at on the basis of AI-driven fundamental analysis based on pre-built models and price history.
The Overview page also offers qualitative insights in the form of tips. Both negative and positive insights are highlighted in red and green to help you understand the stock’s performance.
These tips can help you understand if the stock is in oversold territory, if it is overvalued or undervalued, and much more. The tips also highlight negative insights, such as whether the stock is trading at a high Price-to-earnings or P/E ratio.
The Financial Health indicator on the home page gives you an assessment of the company’s financial health across different parameters such as Cash Flow, Growth, Price Momentum, Relative Value and Profitability Health. The performance of the company is assessed across these parameters, and a rating of 1 to 5 is given to help you understand how the company is doing financially. The company’s financial health is determined by ranking the company on over 100 factors against companies in the same sector and operating in similar developing economic markets, like India. The financial health indicator also lets you dive into the company’s financial performance details over more nuanced parameters.
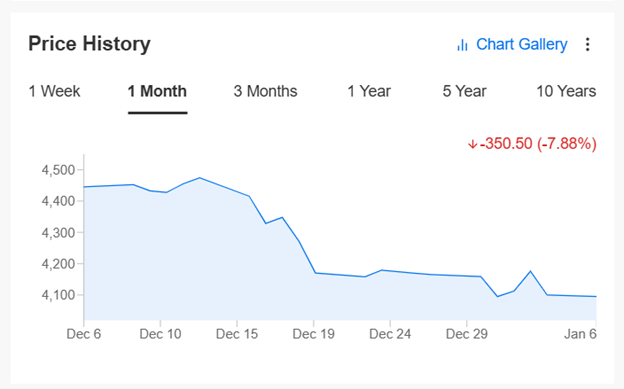
The Price History indicator on the Overview page informs you of the stock’s price movement across different timelines ranging from 1 week to 10 years.
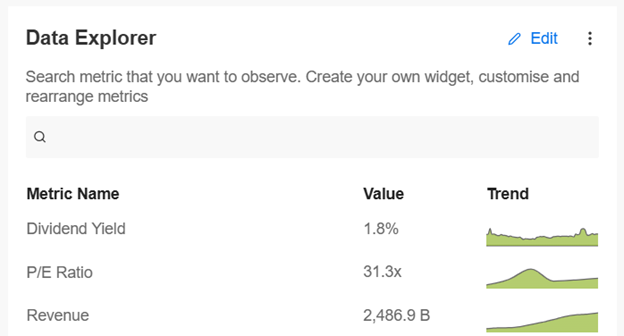
The Data Explorer feature gives you access to different data points and their trends. You can choose different metrics and create your own widgets to access the metrics you find most useful and informative easily.
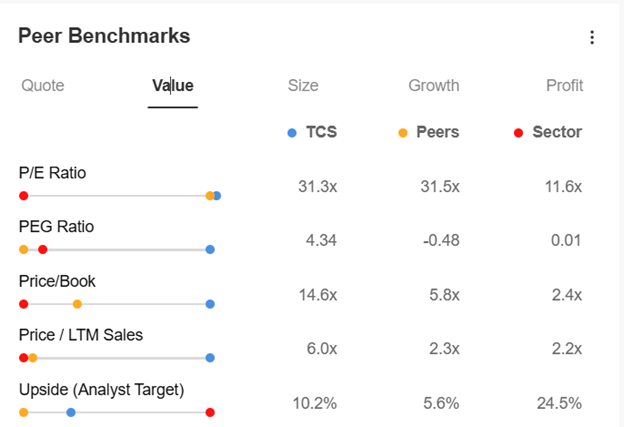
The Peer Benchmark widget gives you insights into how the company has fared in comparison to its peers in the same sector and across different metrics like revenue, operating income, market cap and key financial ratios.
The Overview page also lets you go through the company’s financial figures. The Historical Financials widget shows key figures from the company’s Income statement, Cash Flow Statement and Balance Sheet.
If you want access to detailed analysis and insights, you can go through the Dividend, Earnings, Financials, Health, etc. pages, each of which provides detailed insights for these parameters over and above the brief summaries on the overview page. These detailed insights can help you make more informed choices if you’re someone who can afford the time to analyse on your own using the multitude of tools and indicators offered by InvestingPro. However, information on the Overview page can get the job done for investors who do not have the time or knowledge to undertake in-depth research and analysis.
The Stock Screener on InvestingPro lets you use a combination of different filters to identify specific stocks across trading regions and stock exchanges. Besides customizing your own screener based on a combination of filters, you can also explore different in-built strategies offered by InvestingPro to identify stocks based on pre-built filters.
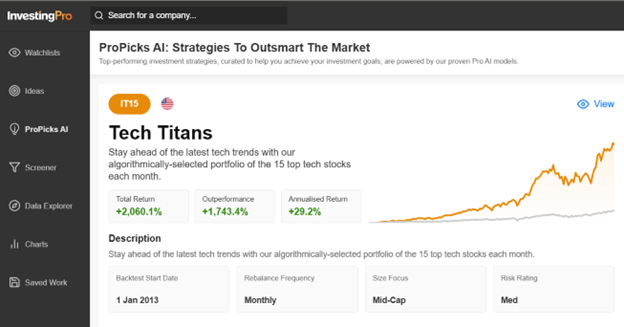
If you’re looking to invest in US Stocks, the ProPicks AI tool can be a great boon for you. The ProPicks Strategies utilize a blend of AI and human analysis to spotlight stocks with a potential to outperform market benchmarks. InvestingPro’s AI model analyzes historical financial data to categorise and rate different stocks and their historical performance. Based on this, ProPicks suggests several ready-made strategies for you to explore and invest in.
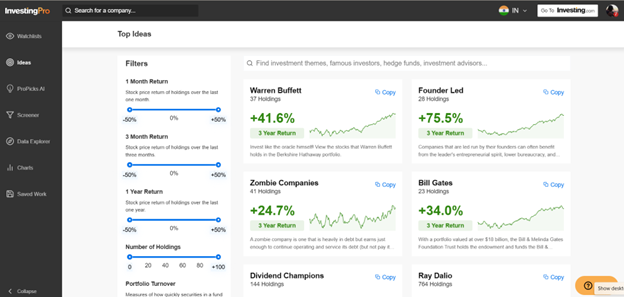
The Ideas feature gives you access to the strategies used by famous investors, hedge funds, and investment advisors. If you choose to do so, you can simply copy their strategies and invest accordingly. Besides famous investors, ready-made strategies based on investment themes are also available for you to explore.
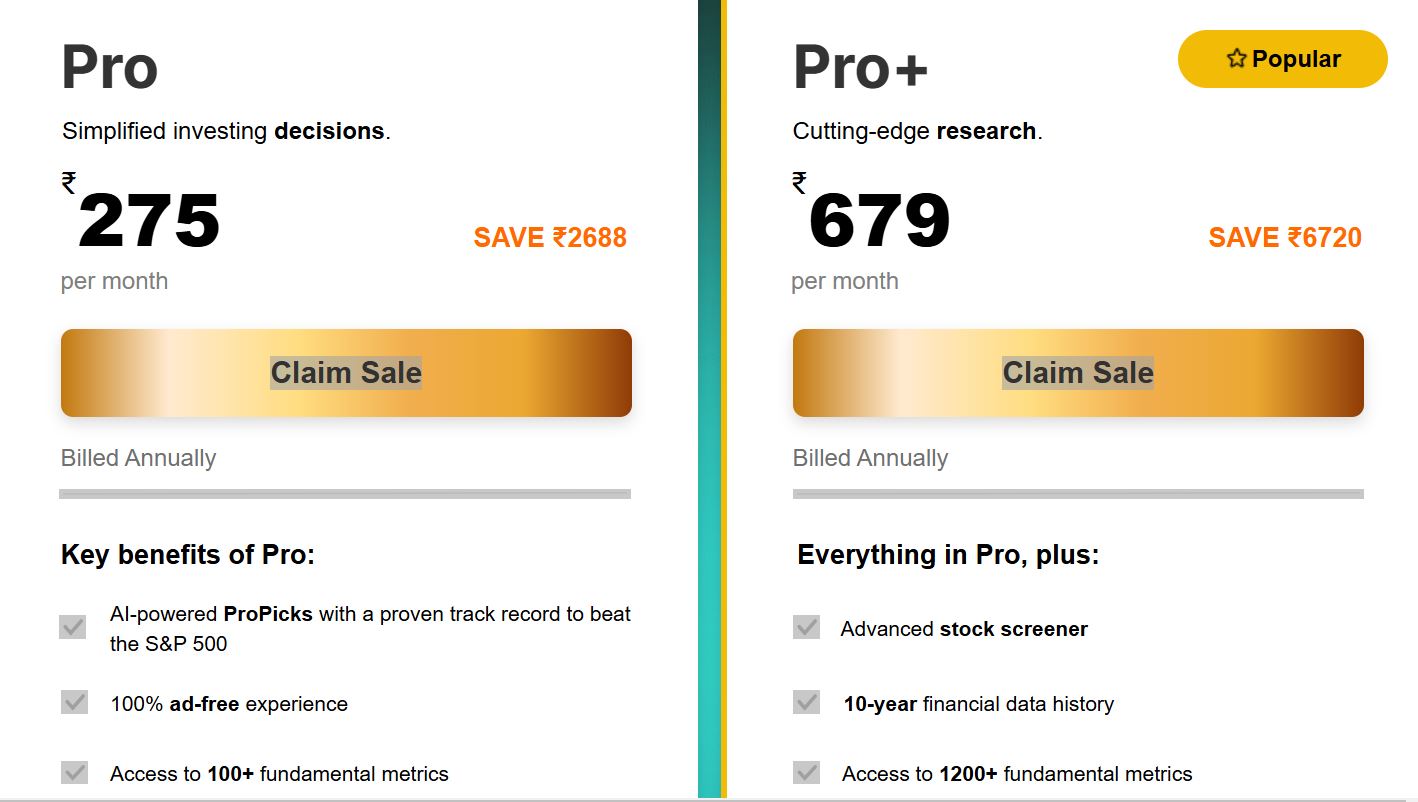
InvestingPro Pricing
Investors using the above code to subscribe the investingpro will get a 50% discount on the market price. Currently, there are 2 plans being offered in the premium category. Based on the requirement you can choose and buy
InvestingPro Alternatives
There are several resources available online for investors to do their homework before investing. These resources are available both at free of cost and for a subscription amount for more nuanced insights. You can read our comprehensive guide on the best platforms for stock analysis in India, to look at some of the best stock research and analysis platforms. For your reference, the following are some of the InvestingPro alternatives you can explore:
- Moneycontrol
- Screener.in
- Trendlyne
- TickerTape
- Trade Brains
- Finology
- StockEdge
Platforms like Moneycontrol provide real-time data and comprehensive insights, while Screener.in, Trade Brains and Finology focus on fundamental analysis and education. Tradingview and Trendlyne offer advanced charting tools for technical traders, while TickerTape combines ease of use with deep analytics.
Conclusion
At the beginning of this article, we have tried to highlight how information forms the bedrock of investing briefly. Having access to the right research and analysis tools can make your job simpler, without having to go through gazilions of data points on your own. InvestingPro, being offered by Investing.com is a reputed tools across the world and covers over 135,000+ international companies, ETFs, and more. Features like Fair Value indicators, ProPicks and Ideas can come handy if you do not have the time and requisite knowledge to do your own detailed research and analysis.
