Everybody knows SIP are good.The rationale for SIP investing is not based on any mathematical model but psychology of consistency.It just to average the cost of investment using disciplined periodic investment. The underlying idea is that its hard to time the market if not impossible. Various methods have been devised to predict market direction but none have been conclusive.One such way of predicting Index direction to see if it is undervalued or over valued is through PE value
PE is one of the major indicator to predict if market is under valued or overvalued.Lot of people talk about comparing long term average PE and comparing it with current and thus timing market.
The major drawback with it are:
- what period to consider for long term 5 year,10 year etc?
- The Index constituents are changed frequently(6 months or so) and thus PE keep changing
- If their had been a major depression in past(2008 etc) average PE would be depressed.
- It doesn’t factor in the inflation adjusted price change of Index.
- Our prediction can be wrong and plan backfire if market tanks so market timing doesn’t work
Some people use CAPE PE ( capital adjusted PE) which is nothing but average earning over a period as denominator.Again it also suffer from impact of period of high or low earning in that past window leading to depressed or inflated PE
Lets take something more simple and easy to observe: The Return of the Index.
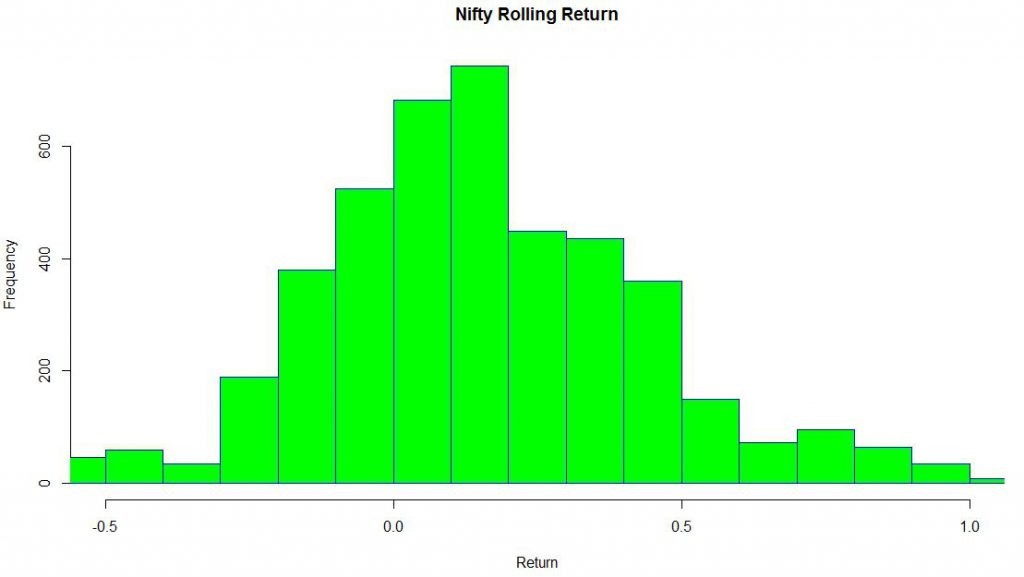
The rolling yearly Return of Index :It is the yearly return of the index taken every day using one year period.Lets plot the return for last 18 years:
As we can see it follows more or less a normal distribution.
Average Return are 15% while Median Returns are 13%. It means that almost 50% times one year return where higher than 13% and other 50% times less than 13%
We understand we cannot predict the direction but one thing we are sure we are investing in market because we expect a long term positive expected payoff .It means that in the long run we think its profitable to put money in the market. Using the information we got from the graph can we find an edge?
When we are moving towards extremity of the graph we see the frequency of returns are diminishing.So in a way its rare to get those kind of yearly returns!So if one rolling year gave me -50% return there is higher chance that my next few rolling return will move toward the center.
Knowing this we can apply Kelly Criterion to enhance our return.How?
From the figure we can see that market has given -10% negative return only 8% times.It means this is an unusual return and we have a slight positive chance (maybe lets say 55% ) that my next rolling return would shift towards center again(towards normal range) so if i use kelly criterion which say I increase my bet when prices are favorable ! and similarly when the opposite happens i.e. return are more than normal I slightly lower my bet
In other words when market returns are above the median returns compared to our reward to risk is low so place lower bets and when market return is way below average return our returns compared to risk can be high so we increase the bet size!
If Ileave extreme rare event my range is broadly from -70% to 100%.So I should have a SIP which can cover the whole range
If 40000 is the maximum possible investment I can do in a SIP then my base SIP should be 10000 and max SIP 40000.
So at 13% median return I will invest 10000 and gradually increase and decrease across range.We have considered median and not average because average returns get impacted by outliers
My Investment pattern will look something like this :
I have taken base as 10% and for every 10% change in rolling return I increase or decrease my investment by 10%.Backtesting Result for a daily 10000 base SIP gives :
XIRR = 14.39%
Total AUM accumulated = 18.31 Cr
For a Regular SIP :
XIRR = 13.57%
Total AUM accumulated =16Cr
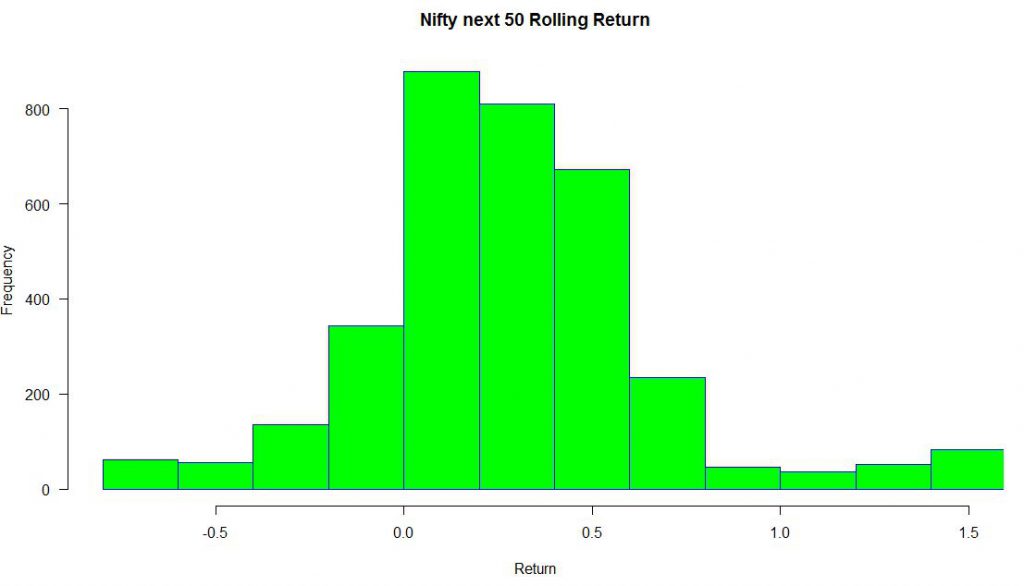
For Nifty Next50
Median is higher at 20%.
Results:
XIRR = 18.44%
Total AUM accumulated = 15.84 Cr
For a Regular SIP :
XIRR = 17.24%
Total AUM accumulated =13.75 Cr
What I have done is I have tried to place bigger bets when odds are favorable and lower bets when odds are unfavorable. In short time frame luck can cause random results but as my bets keep growing small edge keeps adding until I have a substantial edge which translates into higher profit!!.
Its like tossing a coin which is slightly biased towards head. If i toss it 5 times maybe only 1 head comes ( equivalent to market timing where I might be true yet I fail) but If i toss it million times I know more than 50% times it will land on Head
Inference:
- We are not only able to get higher return but also we are able to collect higher AUM ( because we are making exponential bets which means our SIP are growing faster at decline while reducing less at rally)
- Results are better for Nifty Next 50 because higher volatility allows more betting but also means we should change our bet size in smaller proportion
- Perform Monthly SIP as daily is not practical.Keep changing size based on Rolling Return
- Use Nifty ETF and Nifty Next index Fund for investment add a couple of mid and small cap fund
- This strategy should not be used with mutual Funds because Fund manager keep churning the portfolio which will take away the edge!

