Each platform has different types of Loans and different Returns. How do we compare the platform Returns. An easy way is to see for each category how much Return you are making after factoring in the Fees and NPA.
I have two ways of doing it. One is to rely on platform published data and other to extrapolate my returns as assume in future portfolio will deliver similar returns.
I have calculated both numbers and compared them
I2IFunding:
Let’s the check the Interest Rate published on the platform:
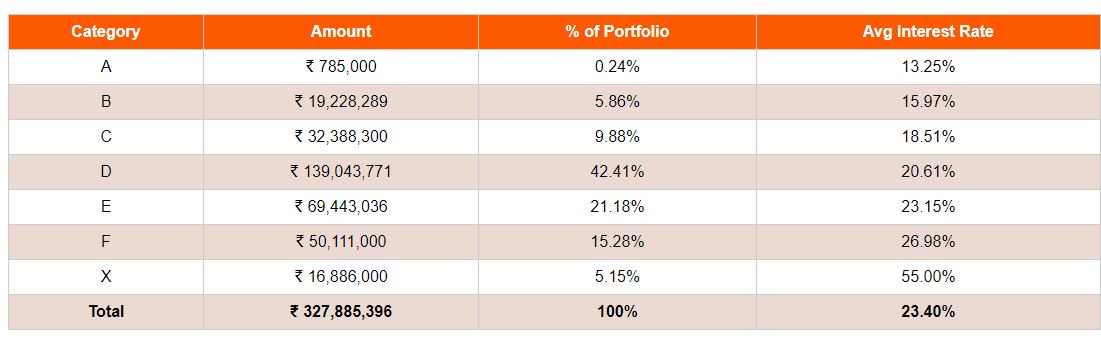
Almost 70% loans are in the range of 18.5%-23% .
Platform NPA status:
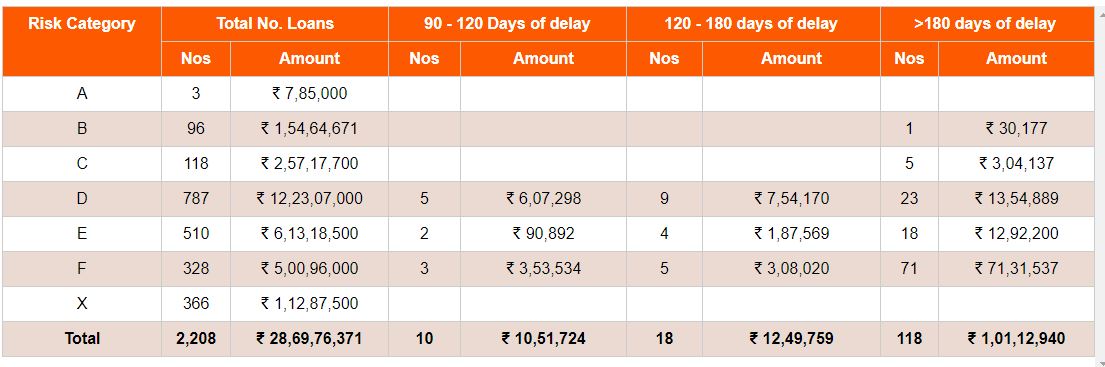
If you calculate in terms of Percentage loans delayed beyond 90 Days are around 4.6% .
My actual portfolio average ROI is 22% and NPA is around 4.5%. Hence Risk adjusted Return = 22%-4.6% =17.4% .
If i deduct the Fees in the long term I should make around 15-16% if things remain the same which is approximately equal to what I am already making.(15%).
My portfolio Returns are at par with platform performance
RupeeCircle:
ROI for Rupee Circle:
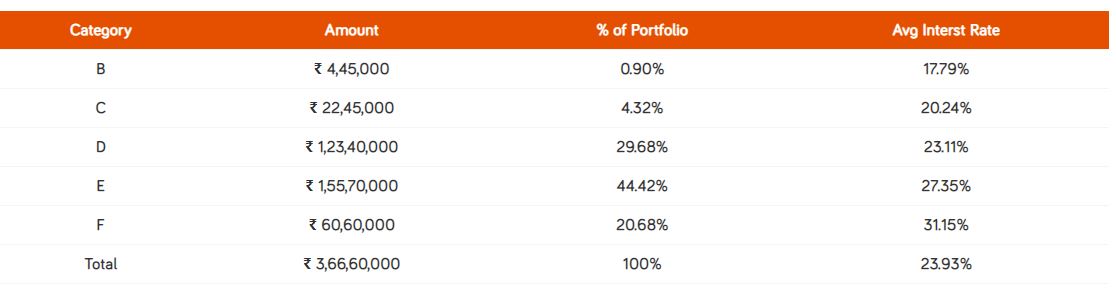
Average Return is approximately 25%
Platform NPA status:
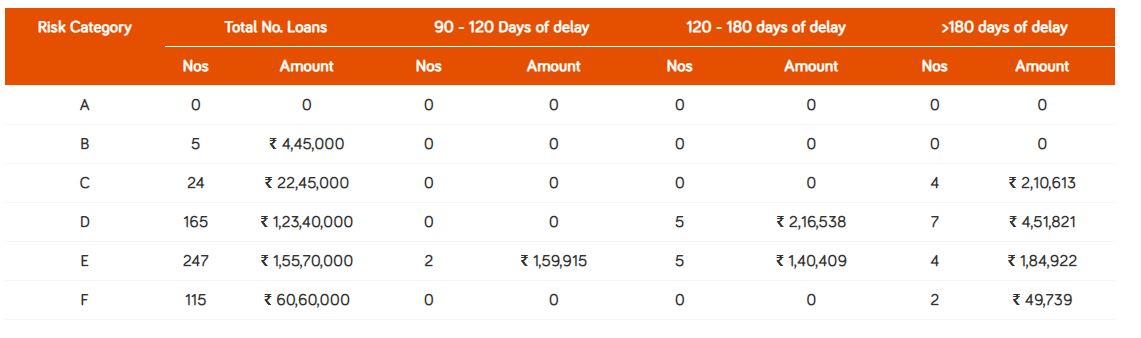
If you calculate in terms of Percentage loans beyond 90 Days are around 4.2% .
My portfolio average ROI is 25% and NPA is zero at the moment. Hence Risk adjusted Return = 25-0-2.5% =22.5% .
With time my NPA should increase to platform level and then after fees I should make 25-4-2.5%= 18.5% (as fees in rupee circle is slightly higher than I2I)
Also remember that rupee circle has less number of loans till date and its NPA may rise . But at the moment I am generating Higher Risk adjusted Return than I2I platform.
LendenClub:
Lenden ROI
.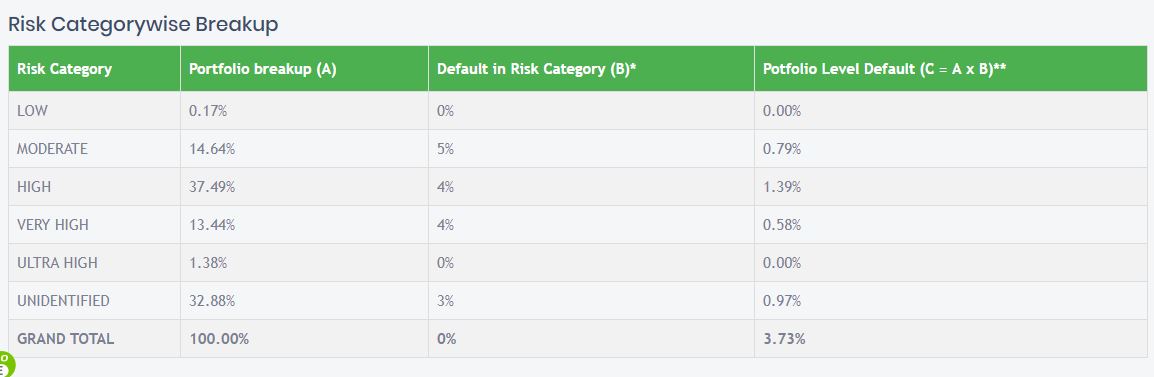
They have not mentioned but as of now 75% of loans are in unidentified category with average ROI = 48% and others in high and ultrahigh with average Interest = 26% approx
LendenClub NPA:
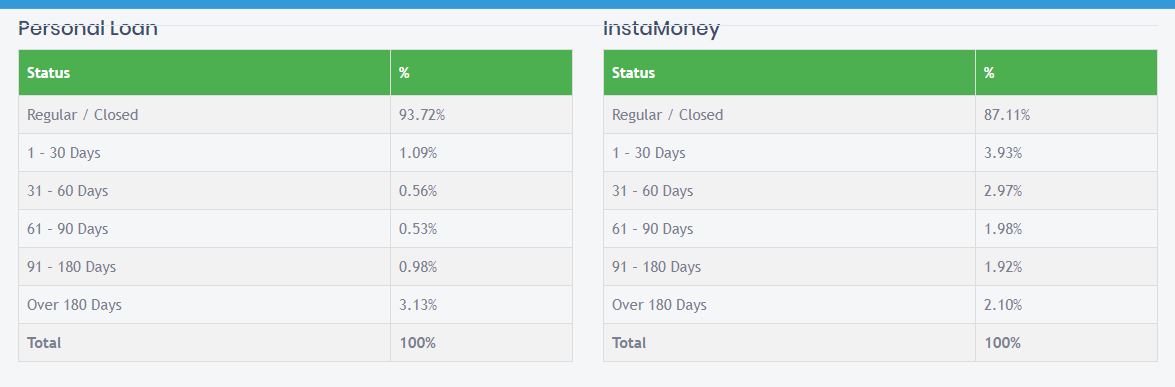
Interestingly NPA for Instamoney (short term loan) is published separately which is a good thing as it is a different asset class and NPA should be read in a different way. Total NPA published in instamoney =4% approx . A 4% default annualized will be approximately 16% plus annually and after fees you will get 48% -16%-4% =28% .
My portfolio instamoney NPA is around 7.5% which is around 30% annually but this class is pretty volatile. Which makes my return around 48% -30%-3.5%= 14.5% .
Good part is you get lot of loans and can use auto disbursal also but do expect lot of NPA and volatile returns.
For Non Instamoney Portfolio NPA = 4.11%.
My personal portfolio non Instamoney average return is 26% .My NPA is around 6%. After factoring in Fees I will make= 26%-1.5%-6% = 19%.
Cashkumar:
Cashkumar has only one fixed interest Rate =41%
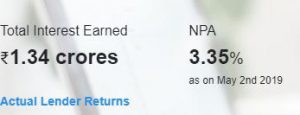
Again as loans are short dated (approx 4-5 months) 3.35% NPA will approx equal to 8-9% annually.
My historical NPA has been close to 5% which will be approx 14-15% annually . After Fees I should make close to
41% -15%-1%= 24-26% if the NPA does not go higher.
But in short term loans you need to be wary of any change in NPA as they can impact the ROI fast.
OMLP2P:
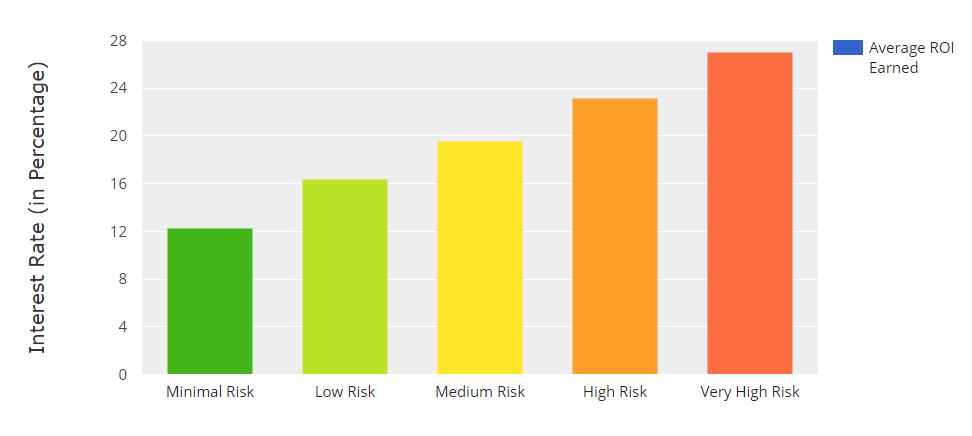
Average ROI in OMLP2P = 23-24%
NPA in OMLP2P

As of now NPA is extremely low <1%.
With time NPA should go up. I expect NPA to go upto 4% plus and average Risk adjusted Return to be 16-18% after Fees.
As of now my Risk adjusted Return = 20%
Faircent:
Faircent ROI:
Faircent NPA
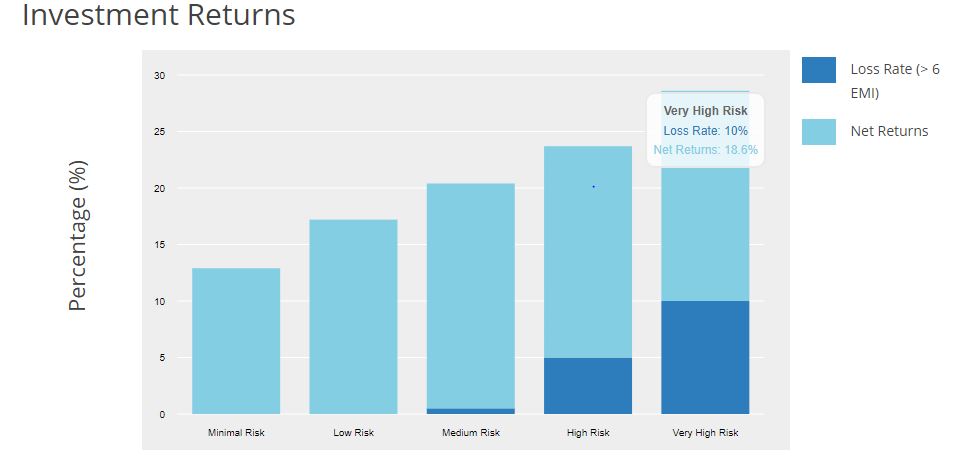
Faircent consider NPA after 6 EMI delay which is 180 days. For 90 Days delay you can double the delinquency.
My portfolio return after factoring NPA has barely been 4-5% after Fees.
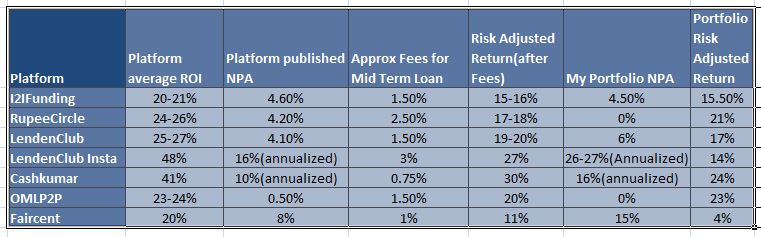
Summary of Performance in table:
My article on Fees comparison:
http://randomdimes.com/2019/p2p-lending-platfrom-fees-comparison/
Observations:
- Your Total returns should fall into 15-25% range if you are sufficiently diversified
- Platform like I2I funding, RupeeCircle and OMLP2P have less divergence between platform published numbers and my portfolio returns.
- Faircent has the lowest risk adjusted return while cashkumar highest.
- Cashkumar and Lenden have high yield and more volatile returns thus can be used to enhance yield(Like midcaps )
- I2I ,RupeeCircle and OMLP2P can be used to create a stable portfolio (Like Large Caps)
- Short Term loans NPA should be taken with a pinch of salt as portfolio churn is higher and overall capital loss would be much higher than published numbers.
- Combination of these platform is sufficient upto 10 Lakh deployment without problem.
Footnote:
I2I Account Referral Link(Use Code I2I50%DISCOUNT while paying to get 50% off,Mail me after registering to get further benefits)
Rupee Circle Referral Code- PIND145
Rupee Circle
LendenClub Referral Code – LDC11989
LendenClub
OMLP2P Referral Link
Mail me to get Cashkumar Referral
LendenClunb and Cashkumar or any other platform need to learn from i2i or RupeeCircle. It is clear that the bread butter deals on LendenClub is unidentified, which is short term and requires up to date disclosures on NPAs. However, they performance stats is still as of March 2019. I am not impressed. If they have nothing to hide, why to take so much of time to disclose. I do not think they will sustain.
I agree for lendenclub . They are slow in publishing numbers. Cashkumar do put the NPA performance religiously .
Lendenclub also does not update on collection process which is a real bummer!