Introduction
In 2025, navigating the stock market can feel overwhelming with thousands of companies listed on exchanges like the NSE and BSE. With metrics like PE ratio, ROE, and market share to consider, investors need tools to simplify their research. Tijori Finance has emerged as a popular platform for Indian investors, especially through its partnership with Zerodha, powering features like Timeline and Stock Insights on Zerodha’s Console. But is Tijori Finance the right tool for you? This review dives into Tijori’s features, pros, cons, and how it stacks up against competitors like Tickertape and Screener.in Trendlyne and TradingView. We’ll keep it balanced, highlighting what Tijori does well and where it falls short, to help you decide if it fits your investment style.
What is Tijori Finance?
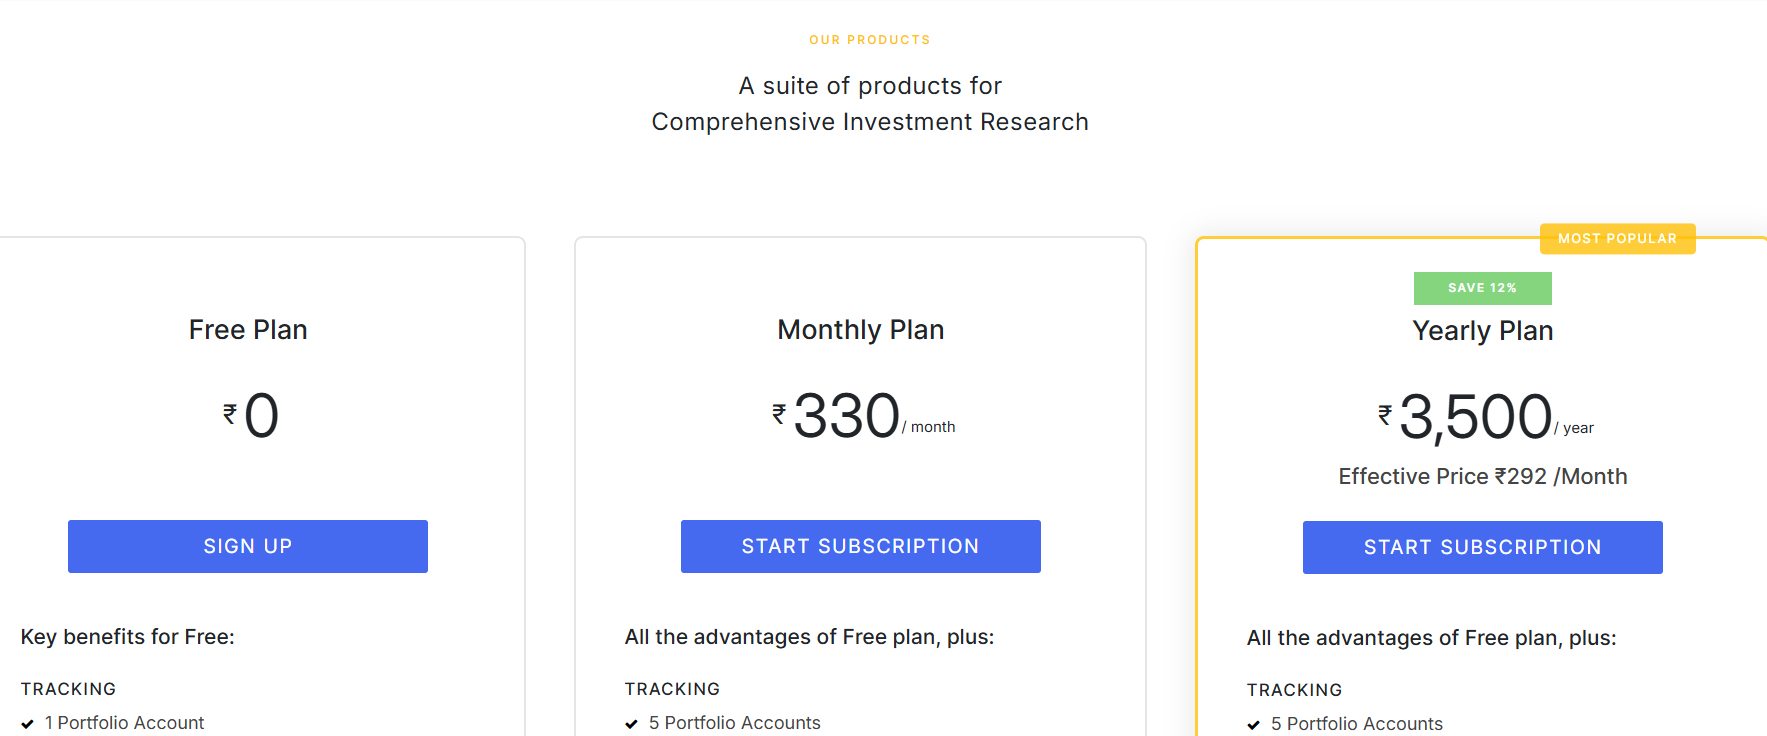
Tijori Finance, founded in 2016 by Tejas Goenka, Varun M, and Siddharth Hegde in Bengaluru, is a web-based platform designed for individual investors to research and track stocks. It offers in-depth data on companies, including financials, market share, revenue breakdowns, and operational metrics. With a valuation of $11.3 million after raising $2.3 million from investors like Zerodha and Tally Solutions, Tijori has become a trusted name, particularly for Zerodha users, as it integrates with Zerodha’s Kite and Console platforms. Tijori provides both free and paid plans (330/month; 3500/year), catering to investors seeking detailed fundamental analysis.
Tijori’s mission is to streamline stock research by consolidating scattered data—financials, peer comparisons, news, and sector insights—into one place. Its partnership with Zerodha, announced in 2024, enhances its visibility by powering features like the Fundamentals widget and Stock Pages, making it a go-to for many Indian investors.
Key Features of Tijori Finance
Tijori Finance focuses on two core areas: tracking tools and research tools. Below, we break down its main features and how they support investors.
Tracking Tools
Tijori’s tracking tools help investors monitor their portfolios and watchlists effectively:
- Timeline: A personalized feed offering real-time updates on stocks, including exchange filings, credit ratings, insider trades, market news, and business changes. Free users can track one portfolio, while paid plans allow unlimited portfolios with detailed performance metrics.
- Portfolio Section: While Tijori doesn’t support direct investing, it allows users to monitor daily, weekly, and monthly portfolio performance, including gains/losses and top-performing stocks. It syncs with brokerage accounts like Zerodha for seamless data import.
- Watchlist: Users can add multiple stocks and compare fundamentals like PE ratio, market cap, and reverse DCF (Discounted Cash Flow, available in paid plans). This feature simplifies side-by-side analysis.
- Alerts: Set price and volume alerts to stay informed about key movements, ensuring you never miss an investment opportunity.
Research Tools
Tijori’s research tools are designed for in-depth analysis of companies and sectors:
- Company & Sector Research: Search for a company or sector to access comprehensive data, including financials, shareholding patterns, and operational metrics. For example, for HDFC Bank, Tijori provides banking-specific metrics like CASA ratio, Net Interest Margin (NIM), and NPA levels.
- Stock Screener: Filter stocks based on criteria like monopoly companies, market share, or investment strategies (e.g., Warren Buffett’s Cigar Butt theory). This helps investors shortlist stocks matching their preferences.
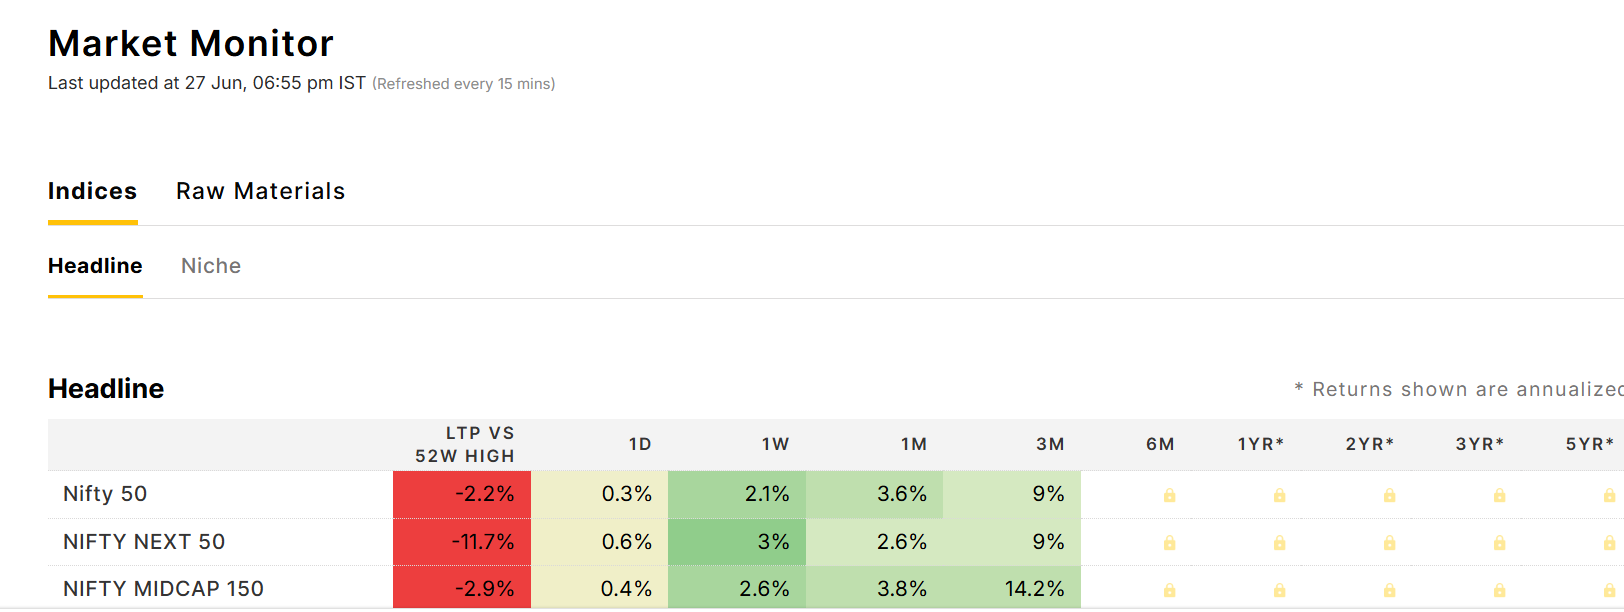
- Market Monitor: Analyze market trends across indices like Nifty 50 or custom indices like TJI QSR+. It also includes a raw material monitor for tracking price movements of commodities like metals or chemicals.
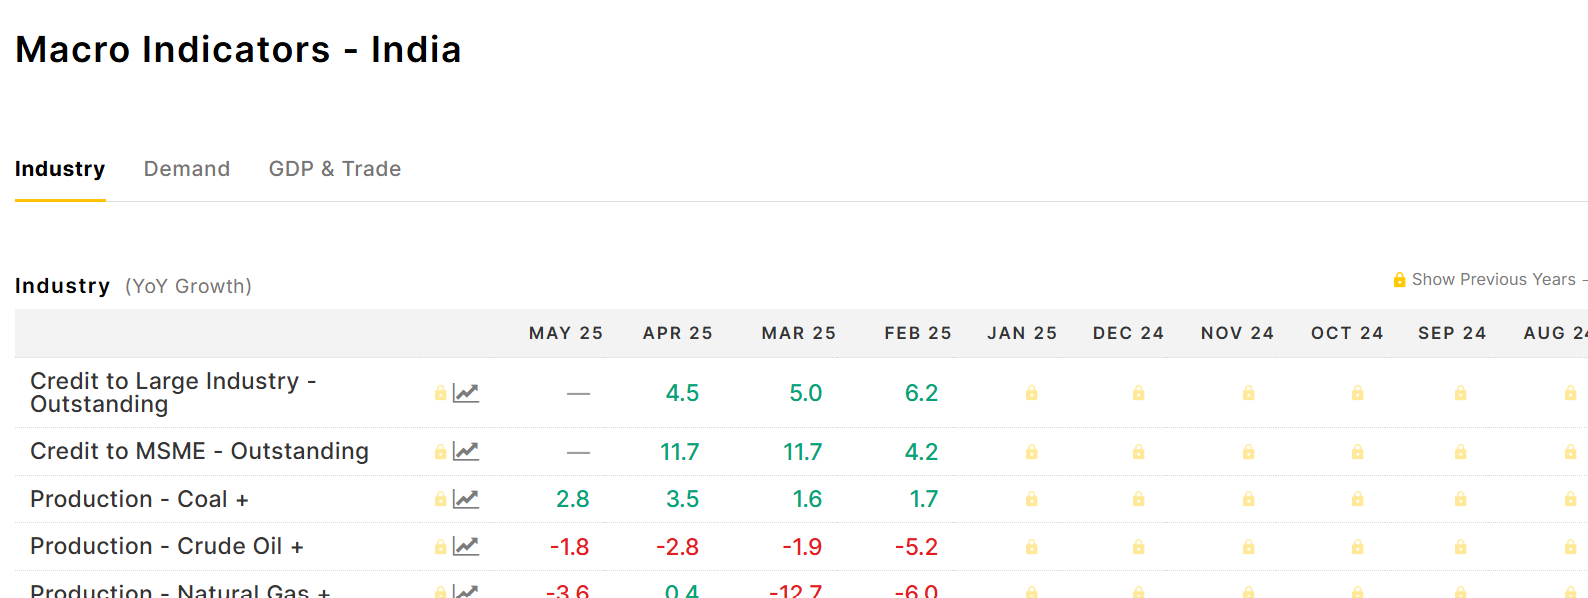
- Macro Indicators: Track economic trends like GDP growth, industry demand, or inflation to contextualize investment decisions.
- Forensics: Assess a company’s financial health with sector-specific metrics. For banks, this includes ROE and Net NPA; for non-banks, it covers revenue growth and debt-equity ratios.
Zerodha Integration
Tijori’s integration with Zerodha’s platforms is a standout feature. The Timeline and Stock Insights on Zerodha’s Console provide a chronological feed of stock events and a snapshot of fundamentals, respectively. The Fundamentals widget on Kite offers quick access to valuations, revenue breakdowns, peer comparisons, and shareholding patterns. These features are particularly useful for Zerodha users, as they consolidate data without requiring multiple platforms.
Pros of Tijori Finance
Tijori Finance has several strengths that make it appealing for serious investors:
- Intuitive User Interface: Tijori’s clean, data-heavy interface places key metrics like financials, shareholding, and revenue breakdowns at the top, saving time for users. The landing page for company searches is well-organized, making navigation straightforward even for less experienced investors.
- Industry-Specific Metrics: Unlike generic platforms, Tijori tailors metrics to specific sectors. For example, banking stocks are analyzed using CASA and NIM, while manufacturing firms are evaluated on operational metrics like sales volume. This customization enhances accuracy.
- Comprehensive Data: Tijori sources data from company annual reports, ensuring authenticity. It covers financials, market share, location exposure, and shareholding patterns, providing a holistic view of a company’s performance.
- Zerodha Integration: The seamless integration with Zerodha’s Kite and Console platforms makes Tijori a convenient choice for Zerodha users, offering quick access to insights without switching tools.
- Real-Time Updates: The Timeline feature keeps investors informed with real-time news, filings, and insider trades, which is critical for timely decisions.
Cons of Tijori Finance
Despite its strengths, Tijori has notable drawbacks that investors should consider:
- Limited Free Plan: Many features, like reverse DCF, unlimited watchlists, and advanced filters, are locked behind paid plans. Free users are restricted to one portfolio and five alerts, which may not suffice for active investors.
- Outdated Data: Some users report that Tijori’s market share data and Forensics section can be outdated or inaccurate, potentially leading to misleading conclusions. For example, the Forensics outcomes for certain parameters have been criticized as unreliable.
- No Direct Investing: Tijori is purely a research and tracking tool, not a trading platform. Investors must use a separate brokerage to execute trades, which may disrupt workflow.
- Complexity for Beginners: The platform’s data-heavy interface, while intuitive for experienced investors, can overwhelm newcomers who lack financial knowledge.
- Incomplete Data for Smaller Stocks: Tijori’s data is less reliable for smaller or lesser-known companies, which can lead to poor investment decisions. Users on X and forums have noted errors in these datasets.
Comparison with Other Stock Screeners
To provide a balanced perspective, let’s compare Tijori Finance with four popular alternatives: Investing.com, Tickertape, and Screener.In Trendlyne and TradingView. Each platform caters to different investor needs, and understanding their strengths helps contextualize Tijori’s value.
Article on best stock analysis platforms in India
Investing.com PRO
-
Features: Offers real-time data on global indices, commodities, and currencies alongside stock market coverage. The platform includes an economic calendar, portfolio tracker, technical indicators, customizable watchlists, and a wide range of charting tools. Premium users benefit from ad-free access, faster data, and more detailed analysis tools.
Strengths: Broad global coverage with a clean and highly customizable interface. Particularly strong for macroeconomic data, technical charting, and tracking market sentiment. Integrates well with both equity and macro trading workflows.
Weaknesses: Stock-specific fundamentals and sectoral breakdowns are less detailed compared to platforms like Tijori or TIKR. Lacks deep screening or financial modeling capabilities for bottom-up stock research.
Best For: Traders and macro-focused investors who value a global, real-time market dashboard with strong charting tools and economic indicators, rather than deep equity research.
Detailed review of Investing.com PRO
Tickertape
- Features: Offers a user-friendly interface with stock screeners, curated investment ideas, and portfolio syncing with brokerages. It includes a Smart Score for stock evaluation and tracks corporate actions like dividends and splits.
- Strengths: Beginner-friendly, with simplified data presentation and investment suggestions. Ideal for investors seeking a balance between ease of use and depth.
- Weaknesses: Less comprehensive than Tijori for sector-specific metrics and long-term historical data.
- Best For: Casual investors who want quick insights and curated ideas without diving too deep into financials.
Screener. in
- Features: Highly customizable stock screener with over 130 filters, including ROE, debt-equity ratio, and promoter holding. It excels in shareholding updates and historical corporate actions.
- Strengths: Offers complete control over screening, making it ideal for investors who want to build custom queries. The free plan is robust compared to Tijori’s.
- Weaknesses: Lacks Tijori’s sector-specific metrics and real-time news integration. User interface is less polished.
- Best For: Investors who prioritize flexibility and detailed financial screening over real-time updates.
Trendlyne
- Features: Provides deep financial data, broker recommendations, customizable scorecards, and risk analysis. It includes analyst reports and financial forecasts.
- Strengths: Strong for industry-level analysis and premium features like backtesting. More comprehensive than Tijori for broker insights.
- Weaknesses: Premium features are expensive, and the interface requires financial knowledge, similar to Tijori.
- Best For: Serious investors who value broker recommendations and advanced analytics.
TradingView
- Features: Focuses on technical analysis with advanced charting, backtesting, and technical indicators. It offers limited fundamental data compared to Tijori.
- Strengths: Excellent for traders who rely on charts and technical strategies. Highly customizable for technical screeners.
- Weaknesses: Weak in fundamental analysis and sector-specific insights, making it less suitable for long-term investors.
- Best For: Technical traders who prioritize charting over fundamental research.
Comparison Table
| Feature | Tijori Finance | Tickertape | Screener.in | Trendlyne | TradingView | Investing.com Pro |
|---|---|---|---|---|---|---|
| Data Depth | Comprehensive, sector-specific | Simplified, good depth | Extensive, customizable | Deep, with forecasts | Limited to financials | Broad macro & market data, less stock-specific detail |
| Screening Tools | Long-term focus, peer comparison | Smart Score, curated ideas | Highly customizable | Advanced, with alerts | Technical-focused | Basic screeners; strong for macro, indices, and commodities |
| Sector & Peer Analysis | Strong, industry-specific | Moderate | Limited | Strong | Limited | Limited peer/sector granularity |
| Portfolio Tracking | Limited, no direct investing | Synced with brokers | None | Detailed, with risk analysis | None | Yes, with customizable watchlists and portfolio tracker |
| Ease of Use | Moderate, data-heavy | Beginner-friendly | Moderate | Moderate | Advanced, trader-focused | User-friendly, customizable dashboard |
| Backtesting | None | Limited | None | Available in premium | Comprehensive | None built-in; focuses more on real-time and macro indicators |
Key Takeaway: Tijori excels in sector-specific insights and Zerodha integration, making it ideal for long-term investors using Zerodha. Tickertape is better for beginners, Screener is for custom screening, Trendlyne is for broker insights, and TradingView is for technical traders.
Who Should Use Tijori Finance?
Tijori Finance is best suited for:
- Long-Term Investors: Those who focus on fundamental analysis and need sector-specific metrics.
- Zerodha Users: The integration with Kite and Console makes it a seamless choice.
- Experienced Investors: Its data-heavy interface is ideal for those comfortable with financial metrics.
It may not be ideal for:
- Beginners: The platform’s complexity and limited free features can be daunting.
- Technical Traders: TradingView is better for charting and technical analysis.
- Budget-Conscious Investors: Screener.in or Tickertape’s free plans offer more flexibility.
The Bottom Line
Tijori Finance is a powerful tool for long-term investors who value in-depth, sector-specific data and seamless integration with Zerodha. Its intuitive interface, authentic data from annual reports, and features like Timeline and Stock Insights make it a strong contender for fundamental analysis. However, its limited free plan, occasional outdated data, and lack of direct investing capabilities are drawbacks. Compared to Investing.com, Tickertape, and Screener.in, Trendlyne and TradingView, Tijori shines for Zerodha users and those prioritizing sectoral insights, but may not suit beginners or technical traders.
If you’re a Zerodha user looking for a consolidated research platform, Tijori is worth exploring. For a broader feature set, consider Tickertape for ease of use or Screener in for customizable screening. Test Tijori’s free plan at tijorifinance.com or check out its competitors to find the best fit for your investment style.


