Chartink has become one of India’s most widely used stock screening and intraday scanning platforms. If you trade equities or indices in India, you have almost certainly come across Chartink’s real-time scanners or community-built breakout filters.
But here’s the truth most reviews don’t tell you:
Chartink is excellent—but it only solves one part of the trading workflow.
This guide goes deeper than any standard review. You will learn:
- What Chartink really does well
- Its hidden limitations (charts, backtesting, fundamentals, global markets)
- Whether it is enough for intraday, swing, and long-term investors
- How it compares to TradingView & InvestingPro
- The ideal trading stack combining all three platforms
By the end, you’ll know exactly when to use Chartink—and when you definitely should not.
What Is Chartink? A Complete Overview
Chartink is a web-based real-time stock scanner and screener focused purely on Indian markets. Unlike screening platforms that refresh every few minutes, It’s strength lies in its tick-by-tick scanning engine (for paid users), which is why intraday traders love it.
The platform includes:
- Ready-made scanners
- Custom filter builder
- Live alerts
- Basic charts
- Community scan library
Its goal is simple: help traders discover setups instantly.
Most popluar scans include:
- Breakout stocks
- VWAP tests / retests
- Volume bursts
- Trend continuation signals
- RSI crossovers
- Opening Range Breakout (ORB) patterns
- Gainers/Losers with filters
The Platform has grown because it offers speed + simplicity + zero learning curve.
Detailed Breakdown of Chartink Features
Here is a deep dive into the platform’s most important capabilities.
1. Real-Time Intraday Scanners (Chartink’s Core Advantage)
The scanner is the heartbeat of Chartink.
You can filter hundreds of stocks in real time using conditions such as:
- Latest close > EMA(20)
- Price crossing VWAP
- Volume > 2× the 10-day average
- Candle breakout above previous high
These conditions evaluate instantly—not every few minutes—making the signals extremely actionable.
This is why the platform is used heavily by:
- Momentum traders
- Scalpers
- Breakout traders
- Prop desks looking for intraday signals
No other Indian platform provides such fast scanning at this price point.
2. Advanced Filter Builder (No Coding Needed)
Chartink’s filter builder is shockingly flexible without requiring programming.
You can combine:
- Indicators (RSI, MACD, Stochastics, moving averages)
- Price action (high/low break, candle patterns)
- Volume signals
- Relative comparison (current vs previous candles)
Example advanced condition:
Latest close > Latest EMA(50)
and Latest close crosses above Latest High 20 days ago
and Volume > 1.5 × SMA(Volume, 10)
This level of detail normally requires scripting (like Pine Script on TradingView), but Chartink makes it simple.
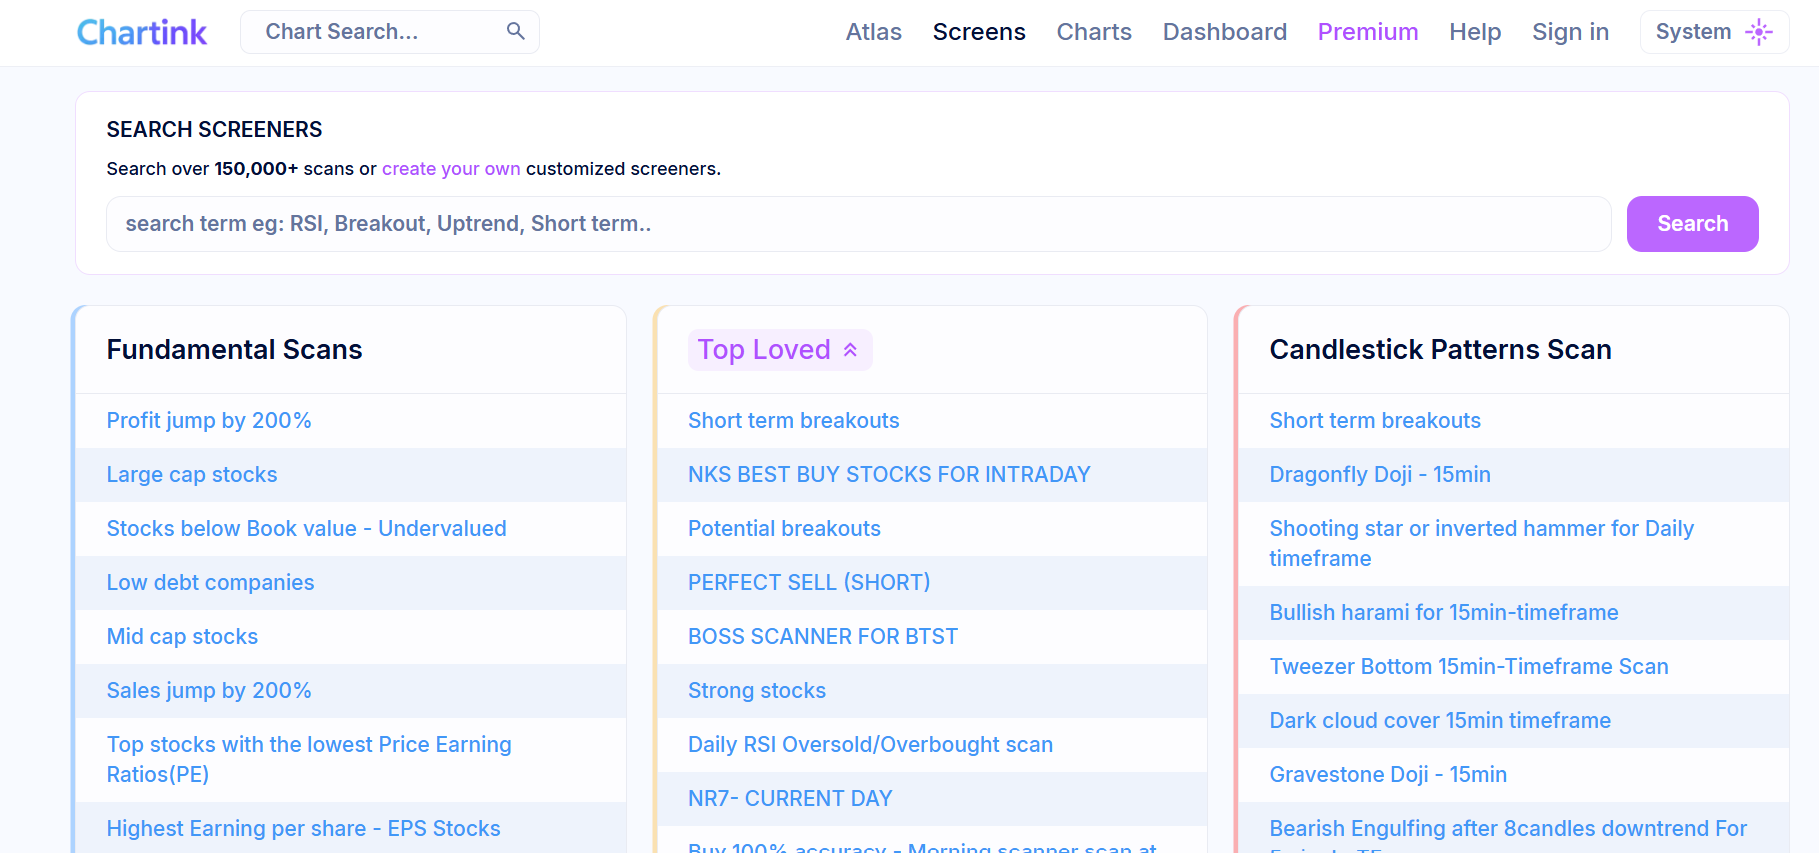
3. Thousands of Community Scanners
Chartink has one of the richest Indian scanner libraries, including:
- Open=Low/High scans
- Gap-up & gap-down lists
- Breakout scans across timeframes
- NR7, inside candles, bullish/bearish patterns
- Trend-following systems
- Volume shock scans
New traders can start using scans instantly without building anything.
4. Alerts & Notifications (Premium)
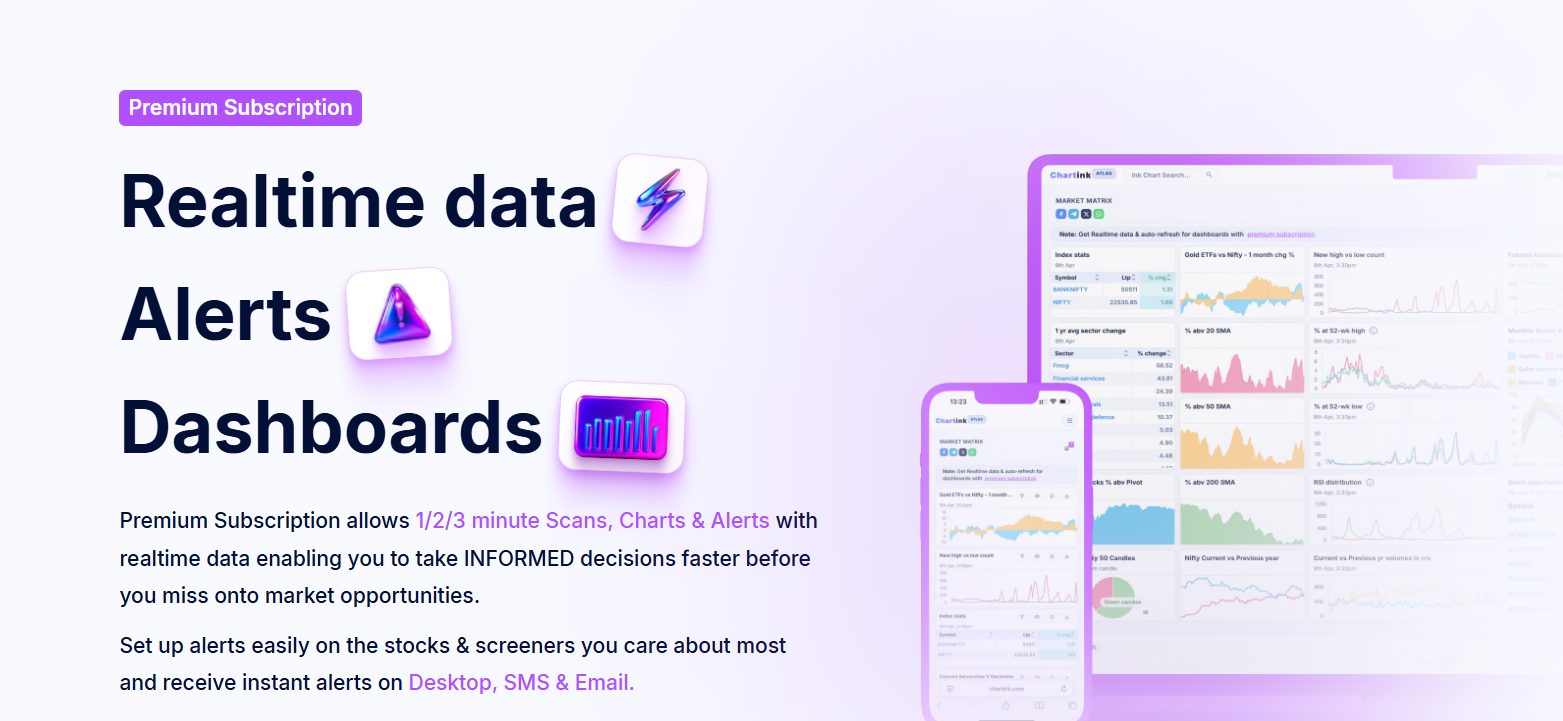
Paid users can receive alerts through:
- SMS
- On-screen pop-ups
You can schedule scans to run:
- Every minute
- Every 5 minutes
- Every hour
- At custom intervals
Perfect for traders who cannot watch markets all day.
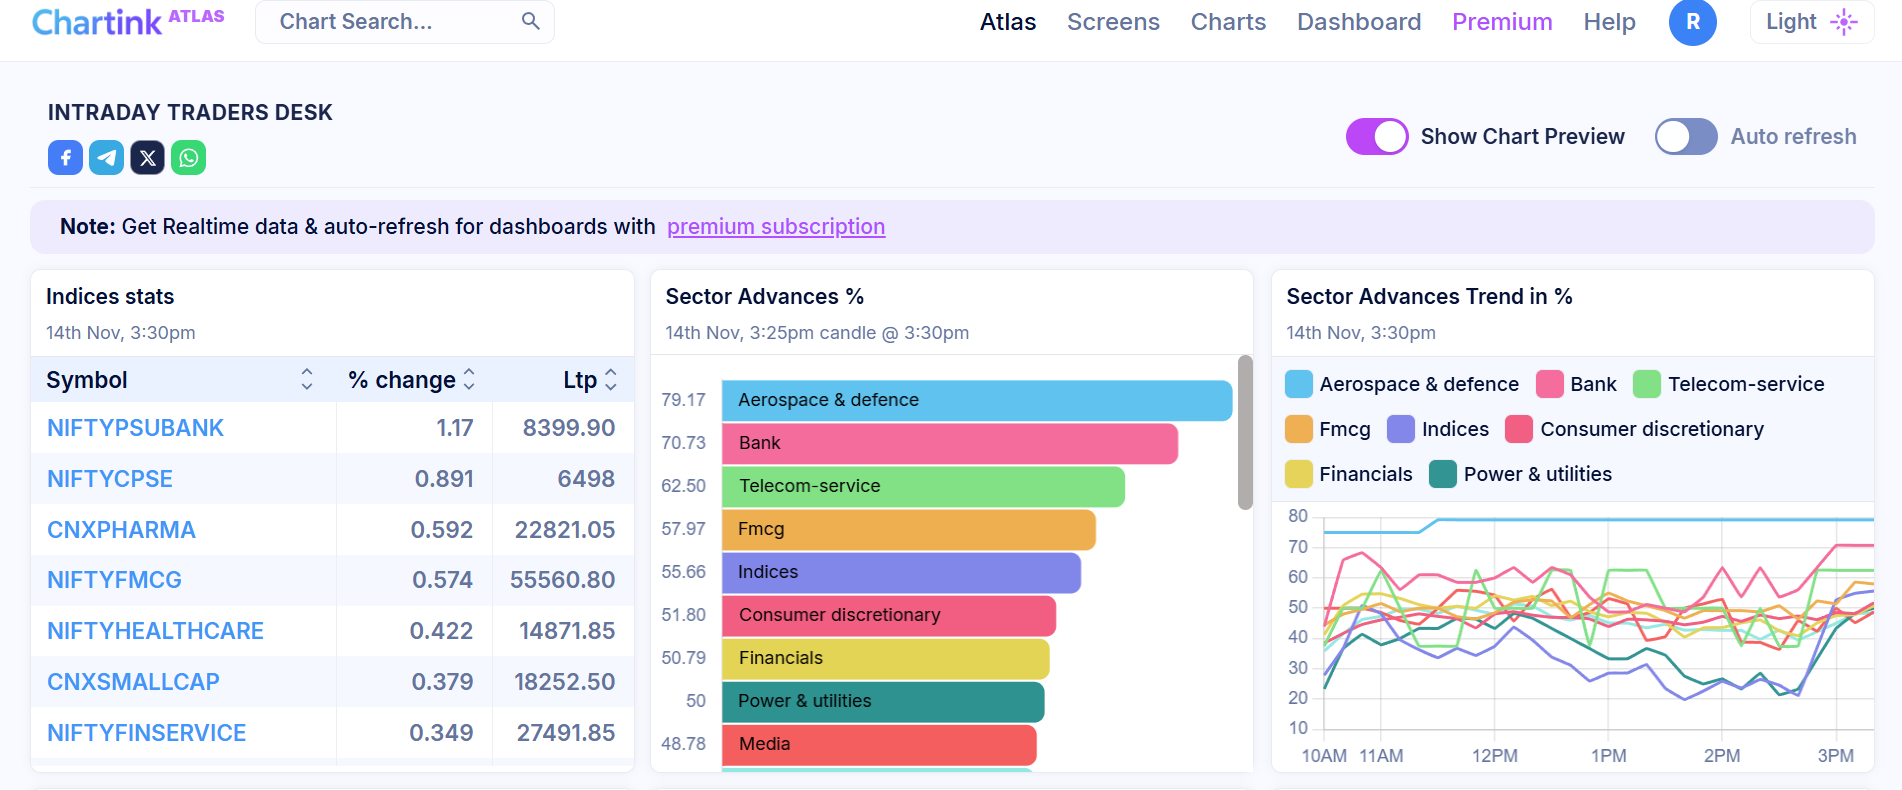
5. Simple Dashboarding
You can build custom dashboards that show:
- Watchlists with real-time updates
- Multiple scans side-by-side
- Market summaries
Dashboards personalize your intraday workflow.
Chartink Limitations (What It Cannot Do)
Even though Chartink is powerful, it has boundaries most new traders underestimate.
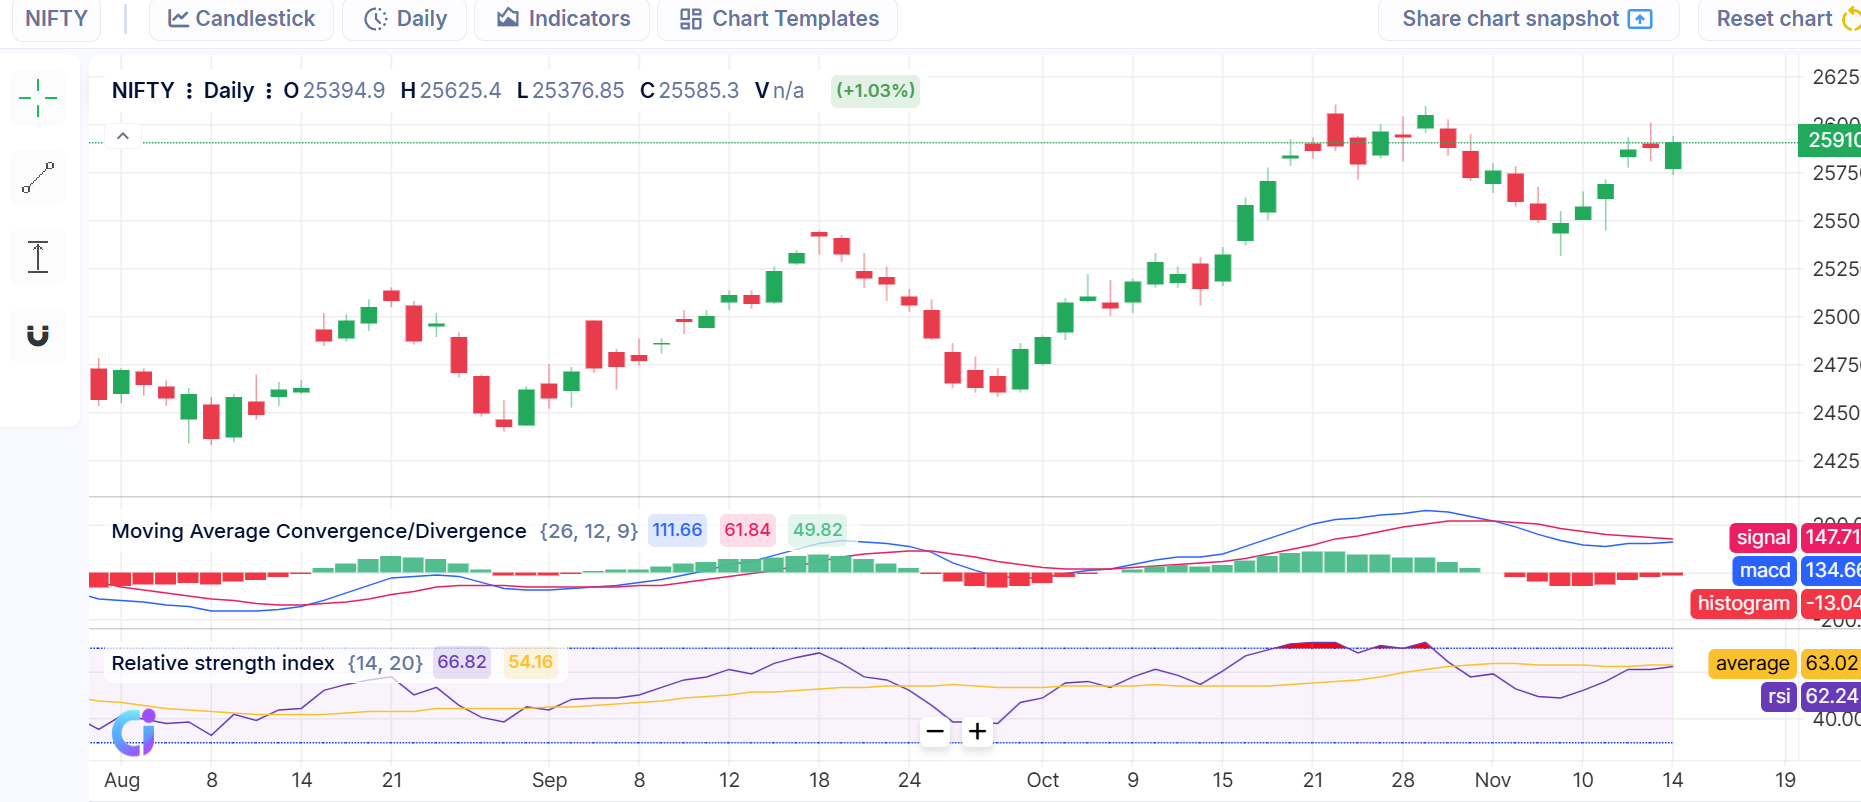
1. Charting Tools Are Very Basic
Chartink does have charts, but they’re not good enough for serious technical work.
Limitations include:
- Minimal drawing tools
- Limited indicators
- No multi-timeframe overlays
- No custom scripts
- No volume profile, footprints, or flow analysis
For proper charting, TradingView is significantly superior.
2. No Backtesting Support
This is the biggest missing feature.
You cannot test:
- How your scan performed in the past
- Win rates
- Average returns
- Drawdowns
- Profit factor
This makes Chartink excellent for discovery, but not for strategy development.
3. India-Only Coverage
If you trade global markets, Chartink doesn’t help.
No:
- US stocks
- Global indices
- Crypto
- Commodities
A global trader needs TradingView or Investing.com.
4. Very Limited Fundamental Data
Chartink focuses on technicals. Fundamentals are extremely basic:
- PE
- Market cap
- EPS
- Basic ratios
No valuation models, no forecasts, no institutional-grade data.
InvestingPro is much better for fundamentals.
5. No Options Data
Options traders cannot use Chartink for:
- OI analysis
- IV
- Greeks
- Option chain manipulation
- PCR-based setups
Again, TradingView or dedicated options platforms are better.
Who Should Use Chartink?
Chartink is best for:
- Intraday traders who rely on fast signals
- Breakout and momentum traders
- Swing traders monitoring volume and trend setups
- Beginners who want ready-to-use scanners
Not ideal for:
- Long-term investors (use InvestingPro)
- US/global market traders (TradingView or Investing.com)
- Options traders needing OI/Greeks
- Traders who depend on backtesting
Chartink vs TradingView (Complete Comparison)
If Chartink is the best scanner, TradingView is the best charting platform.
Detailed Trading View Article.
Where TradingView is superior:
- Advanced charting tools
- Best UI in the world
- Multi-timeframe analysis
- Custom indicators via Pine Script
- Backtesting support
- Options charts + OI visualization
- Screeners for global markets (US/EU/Asia)
So the ideal workflow for most traders is:
Scan on Chartink → Analyze on TradingView → Execute on broker
Tradingview 1 Month Free Trial
Chartink vs InvestingPro (For Fundamentals & Global Investing)
Detailed article on Investing Pro
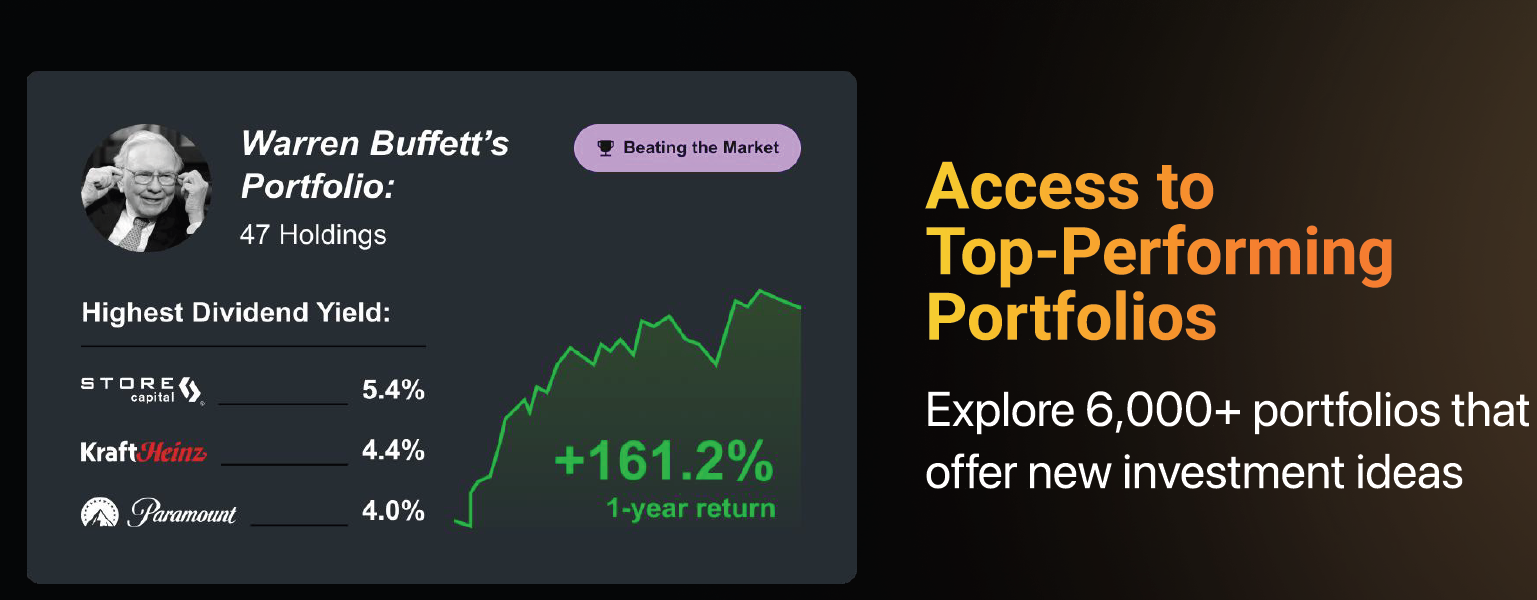
InvestingPro is meant for:
- Long-term investors
- Global market participants
- US stock pickers
- Valuation-driven research
InvestingPro provides:
- Fair value models
- Analyst estimates
- Financial statements for 20+ years
- Peer comparisons
- Global stock screener
- ETF and index fundamentals
This is data Chartink does not offer at all.
60% off on Investing Pro Plan!
Comparison Table: Chartink vs TradingView vs InvestingPro
| Feature | Chartink | TradingView | InvestingPro |
|---|---|---|---|
| Best For | Intraday scanning | Charting & analysis | Fundamentals & valuation |
| Markets | India only | Global | Global |
| Backtesting | ❌ No | ✔ Yes | ❌ No |
| Technical Tools | Medium | Very High | Low |
| Fundamentals | Low | Medium | Very High |
| Custom Scripts | ❌ No | ✔ Pine Script | ❌ No |
| Options Data | ❌ Minimal | ✔ Yes | ❌ No |
| Pricing | Low | Medium | Medium |
Final Verdict: Should You Use Chartink in 2025?
Yes—but only for what it’s good at.
Chartink is the strongest real-time scanner for Indian equities.
It is fast, simple, and powerful for intraday traders.
But a complete trading setup requires more:
✔ Use Chartink for scanning
✔ Use TradingView for technical analysis & global charts
✔ Use InvestingPro for deep fundamentals & valuations
Together, they cover:
- Discovery (Chartink)
- Technical charting (TradingView)
- Investment research (InvestingPro)
This stack is what many serious traders and investors use